Redcliff Capital Research Ltd.

A London Based Quant Research Insitute

img1

img2

SEC主席: 虽然我们今天批准了某些现货比特币ETF的上市和交易,但我们并未批准或认可比特币 (*1)

反洗钱 (*1)

利多面 (*2):

  • 流动性
  • 买卖spread成本

btc-chart

Reference:

[1]SEC approval: (https://www.ft.com/content/73a00ac8-1eaa-4f92-bdef-f3b5970012f7)

[2]btc ETF volume: (https://www.reuters.com/technology/spot-bitcoin-etfs-start-trading-big-boost-crypto-industry-2024-01-11/)

黄金创史高以后后市怎么走?2024还有投资机会吗?

img1

催化剂
催化剂
十年期利率回落 (TMUBMUSD10Y), 美元
年初投资组合再平衡
年初投资组合再平衡
新年前东亚黄金囤货 (政府和个人)
新年前东亚黄金囤货 (政府和个人)
黄金价格逻辑
黄金价格逻辑
通胀 (软硬着陆预期)
通胀 (软硬着陆预期)
供需
供需
etc. …
etc. …
Text is not SVG - cannot display

World Gold Council indicates (*1):

  • 金矿产量同比增长 3%,达到 856 吨。 在因安全原因关闭后,中国恢复了接近满负荷的生产,同时在多个现有地点开采了更高品位的矿石。

  • 再生黄金供应量跃升至 310 吨(同比增长 15%)。 这是六年来黄金回收活动最强劲的第一季度。

  • 中国第一季度强劲开局后,三月份需求几乎陷入停滞。 为遏制 COVID-19 卷土重来而实施的严厉新封锁对珠宝、金条和金币的需求产生了显着影响。

Softlanding Expectation (*2)

[1]world gold council (https://www.gold.org/goldhub/research/gold-demand-trends/gold-demand-trends-q2-2023)

[2]fed watch (https://www.cmegroup.com/markets/interest-rates/cme-fedwatch-tool.html?redirect=/trading/interest-rates/countdown-to-fomc.html)

本周一张图:

CN_CRUDE

本周一张图要说说国内原油储备。在7月的时候国内原油加工厂用量持续走高,但进口桶数下降,形成了一个大剪刀差。路透经济学家预测随着原油加工量增加而进口量较上月下降,中国炼油厂可能在7月份的时候动用了原油库存。7月之前,中国估计一直在储存原油,并加快库存步伐。因为廉价的俄罗斯石油帮助中国加快了六月份原油库存的步伐,达到三年来最大的原油库存增量。我们团队分析可能有两个原因 - 工业恢复导致原油需求意外升高;外汇紧张,导致大宗进口谨慎。我们就不下结论了,结合近期经济数据大家应该会有自己的理解。

本周市场数据:

指数

本周收在4369,低开低走。周五看样子想尾盘偷袭但还是微微收跌,4小时级别的图波动很大,下周要注意踩踏。同时资金周内从股债两个市场同时流进MMF,不是什么好现象。SP500的PUT/CALL率创年内新高,空头可能才刚刚进场,所以预计不会很快止跌。这周我也用闲置的资金做了几个sell call,同时累加了美债头寸。

Week 1 Month 3 Month YTD
-1.29% -0.15% 1.09% 16.56%
板块

sector

本周跌多涨少。板块方面领涨五个板块分别为政府投资,铀,食品零售,能源和医疗服务。涨幅分别为3.6%, 2.47%, 1.01%, 0.8%, 0.74%。可以看出来奥,这周基本都是defensive板块,资金避险情绪重。

美国8月就业数据:失业率上升;就业报告在掩盖什么?

美国劳工统计局大幅下调 2023 年每月就业人数,失业率意外飙升。在今天的非农就业报告公布之前,预测就已经很难看了。一些最大的银行预计数字远低于预期(摩根大通为 125,000,花旗为 130,000,高盛为 149,000,而共识中位数为 170,000)。

今天发布的就业报告称,8 月份美国增加了 18.7 万个就业岗位,超过了 17 万个就业岗位的普遍预期。从表面上看,这意味着与上个月的数据没有变化,当时美国劳工统计局也报告了 187,000 个就业岗位,但为了与最近的趋势保持一致,该数字再次被修改,同时降低至 157,000,这意味着去年每个月的工资单数据都有所修改。 被修正得较低(见下图)。这种大规模几乎不可能,除非存在政治压力,要求最初将数据调高,然后在无人关注时将其修正得较低。
payroll_mod

根据这几个月劳工部数据,7 月下调了 30K,从 +187,000 下调至 +157,000,但 6 月的下调幅度更大,下调了 80,000,从 +185,000 下调至 +105,000,这意味着最初报告的 209K 数字已修改为 50 % 下降至 105K,与最初预期的 230K 相比大幅下降。 在此,劳工统计局自豪地报告说,“通过这些修订,6 月和 7 月的就业人数合计比之前报告的减少了 110,000 人。” 不出意外的话,我们现在等待八月份的就业人数也会大幅下修,因为这就是拜登的处理方式。

转到失业率,情况变得非常糟糕:8 月份失业率从 7 月份的 3.5% 大幅上升至 3.8%,而不是预期的 3.5%,新增失业人数为 51.4 万人,劳动力增加了 73.6 万人,其中有 597,000 人新进入劳动力市场,首次寻找工作,达到 2019 年 10 月以来的最高水平。这证实了我们所看到的情况:美国年轻人储蓄被用完,信贷被刷爆。

失业率的飙升意味着经济在 8 月份只能净吸纳 7.7 万人。 与此同时,新工人的激增也抑制了工资增长(下图)。
participants

《华尔街日报》美联储的小喇叭 Nick 评价说,“7 月比 6 月多了两个周末,这往往会导致月工资上涨。8 月则相反(比 7 月少两个周末)。真实的失业情况也去更糟。” 不会影响同比数据,但它可能夸大了 7 月工资环比增长和 8 月工资疲软。”

我们团队认为:正如我们在之前的预测中指出的,劳动力市场确实正在出现裂痕,但劳工统计局正在尽最大努力去美化这一数据。拐点正在到来。

美国二手车价格还能再降吗?

根据最新的数据,二手车价格今年可能已触底。美国最近两年二手车对通胀的贡献都是很大的,所以之后车价走势会对通胀构成什么影响需要在看。

汽车研究公司 Cox Automotive(备受关注的曼海姆价格指数的拥有者)公布了 8 月份的新数据,显示二手车批发价格自 3 月份以来首次月度小幅上涨。8 月份曼海姆二手车价值指数为 212.2,较 7 月份上涨 0.2%。 该指数较去年同期下跌7.7%。 这些价格通常会稍微滞后地渗透到市场的零售端。“八月份批发价格的下跌停止了,尽管这只是今年春季和初夏迄今大幅下跌的一个小逆转。” ,他指出。

报告同时指出,“从历史上看,月度数字与我们自 1997 年以来看到的 0.3% 的平均水平一致。当然,在金融危机、2020 年新冠疫情重新开放期间以及 2022 年低迷时期,8 月份出现了波动;但今年 ,表现看起来比较普通。与上个月的注释一样,当前曼海姆指数水平为 212.2,仅略高于 2021 年 8 月的 212.1。”

used_car

同时,几个月来二手市场状况一直相当稳定,即使更大程度地推动平衡,也不太可能发生太大变化;销售略强于预期,库存仍然紧张,价格维持在比去年同期低 6% 左右的水平。 “预计这些因素将阻止批发价格在年底前大幅下降。”

这是自四月份以来首次月度增长。

今年前八个月,同比下降似乎已趋于稳定。

used_car_yoy

Cox还显示,8月份二手车零售额比7月份增长了5%,与2022年相比略有改善。 二手车平均价格约为 27,000 美元,比 7 月略有下降,但仍处于历史高位。 即使二手车利率达到自互联网泡沫破灭以来的最高水平,消费者仍在购买。

假设美国汽车公会进行罢工,再加上二手车价触底,这会成为重新点燃二手车价格的催化剂吗?

美国股债率观测到顶背离,有望下行

股债率就是股票回报比债券回报,越高说明股价越被高估,反之债券被高估。彭博经济学家最近预计美国股债比率的增长将继续下降,但名义和通胀债券收益率均从严重超卖水平反弹,可能会出现波动。

在大幅波动之后,这通常是一段令人沮丧的时期,因为市场需要一段时间才能稳定下来,并且一个新的清晰的、可交易的趋势变得明显。 我们现在正处于这样的时期之一,但收益率应该整体下行,足以对股债比率施加压力。

几周前股票相对于债券还处于超买状态,我们可能会看到逆转。 此后,股债比率的年度变化已从单一标准差水平下降。

stock_bond

股市在标普指数 4500 点附近遇到了一些阻力。 衰退风险上升以及美联储仍在鼓吹“长期走高”口号的抵消力量将共同推动股市维持在区间内,直至僵局被打破。债券可能有优势,因为它们从非常超卖的水平反弹。

2023 年初实际收益率的涨幅接近 50 多年来的最高水平。 它们的年变化率随后下降,但在过去几周再次反弹。从历史上看,当走势非常极端时,可能会导致整体正常化趋势被打破而出现一段时期的波动。 尽管实际收益率不太超买,但它们仍然向上延伸,这意味着从中期来看,它们应该有向下的倾向。

名义收益率也类似。 它们的超买程度比以前有所减少,并且面临波动,但从长远来看,它们应该有整体下行的倾向。此外,随着波动性稳定下来,+4%的收益率对于许多买家(无论是杠杆还是非杠杆)来说似乎越来越有吸引力,尤其是在人们认为衰退风险正在上升的情况下(尽管投资者不应假设通常的投资规则适用于通胀性衰退)。

最近疯涨的大宗可能是衰退前兆,尤其是油价

家庭支出使美国经济得以维持,但随着增长放缓,石油和天然气价格的持续上涨可能会压低个人消费支出(PCE;这个是美联储经常观测的指标),从而引发近期衰退——而股票和债券的定价并未考虑到这种结果 。

迄今为止,正是消费数据才阻止了经济衰退。 然而,彭博经济研究(BBE)在最近的一篇文章中指出,负面的家庭情绪——与家庭支出的其他驱动因素相结合——表明我们应该已经陷入衰退。美国统计口径大致确定个人消费支出的增长情况。 但如果我们加上密歇根大学的消费者信心指数,它表明个人消费支出增长要弱得多,因此经济可能已经陷入衰退。

retail data

两者之间的差异可能来自密歇根州更注重频繁支出和商业状况,而世界大型企业联合会的指数更关注就业市场。 作为一名雇员,就业市场看起来相当不错,提振了世界大型企业联合会的指数,而密歇根州的调查更多地受到物价上涨和小企业主条件的影响,而小企业主的条件就不那么乐观了。

这凸显出美国经济可能如履薄冰,迄今为止积极的消费者信心代表着这种坚冰,这在很大程度上受到汽油价格(以及人们对油价高低的看法)的推动,而汽油价格仍然相对便宜到目前的水平。

但在流动性过剩、库存下降和供应削减的推动下,油价一直在上涨。石油仍然有利,因此近期天然气价格的上涨也将持续下去。 大宗影响更多的是供给侧,这可能是压垮美国消费者并使美国陷入衰退的最后一根稻草。毕竟零售数据才是支撑美国经济的支柱,而不是工业。

Week Ahead

  • 周三的CPI数据
  • 周四的零售数据和欧盟利率决策

本周一张图:

CN_CRUDE

本周一张图要说说国内原油储备。在7月的时候国内原油加工厂用量持续走高,但进口桶数下降,形成了一个大剪刀差。路透经济学家预测随着原油加工量增加而进口量较上月下降,中国炼油厂可能在7月份的时候动用了原油库存。7月之前,中国估计一直在储存原油,并加快库存步伐。因为廉价的俄罗斯石油帮助中国加快了六月份原油库存的步伐,达到三年来最大的原油库存增量。我们团队分析可能有两个原因 - 工业恢复导致原油需求意外升高;外汇紧张,导致大宗进口谨慎。我们就不下结论了,结合近期经济数据大家应该会有自己的理解。

本周市场数据:

指数

本周收在4369,低开低走。周五看样子想尾盘偷袭但还是微微收跌,4小时级别的图波动很大,下周要注意踩踏。同时资金周内从股债两个市场同时流进MMF,不是什么好现象。SP500的PUT/CALL率创年内新高,空头可能才刚刚进场,所以预计不会很快止跌。这周我也用闲置的资金做了几个sell call,同时累加了美债头寸。

Week 1 Month 3 Month YTD
-2.11% -3.67% 3.91% 14.27%
板块

sector

本周跌多涨少。板块方面领涨五个板块分别为政府投资,铀,食品零售,能源和医疗服务。涨幅分别为3.6%, 2.47%, 1.01%, 0.8%, 0.74%。可以看出来奥,这周基本都是defensive板块,资金避险情绪重。

人民币有可能是今年的黑天鹅吗?

路透社看到的本月一份投资者报告显示,对冲基金 EDL Capital 押注中国离岸货币进一步下跌,并表示人民币贬值可能是下一个扰乱世界市场的“黑天鹅事件”。

今年迄今为止,美元兑离岸人民币已升值约 6% 至7.3,中国国有银行本周纷纷抛售美元以遏制人民币贬值。

管理着约10亿美元资金的EDL Capital表示,影响人民币汇率的因素包括地缘政治紧张局势促使西方国家重新安置供应链,这将使中国缺乏外国投资。报告称,与越南和印度等其他亚洲国家相比,中国劳动力市场的竞争力也有所下降,而疫情后的复苏进程缓慢,外汇储备“可能低于人们认为的水平”。

同时,报告中还指出该对冲基金持有离岸人民币空头头寸。 实现这一目标的一种方法是通过put期权,旨在通过美元走强、人民币走弱在一定价格水平上获利,但没有确认 EDL 是否正在使用这种long-short策略。

中国作为世界第二大经济体,对全球增长至关重要。中国放松货币政策的预期,加上美元走强,已将美国和中国之间的收益率差异推至16年来的最大水平,进一步给人民币带来压力。

这家由明星经理 Edouard de Langlade 管理的对冲基金今年上涨了约 8%。 它是2023年表现较好、在宏观经济信号中寻找交易思路的对冲基金之一。

有趣的是EDL今年的盈利构成。大部分盈利都是通过巴西和日本股票以及巴西利率的多头头寸获利的。 报告显示,矿业交易、美国股票空头头寸以及对中国股票的看涨押注降低了基金业绩。不知道为什么今年欧洲基金经理普遍看空美股。

美国初领失业金环比下降,但累计失业金上升 - 拐点到了?

上周申请失业救济人数持续上升,同时符合经济学家预期。美国首次申请失业救济人数从上周的 24.8 万人小幅下降至 23.9 万人,符合预期。
Initial Claim

自 6 月中旬以来,数据尚未突破 250k 的心理水平。加利福尼亚州和德克萨斯州的首次申请失业救济人数大幅下降,而弗吉尼亚州和爱荷华州的首次申请失业救济人数则有所增加。 加州继前一周大幅上涨后大幅下跌,可以看作是统计上的误差。

持续申领失业金人数与近期趋势相反,自 7 月第一周以来首次回升至 1.7M 以上。从这组数据看,红线首申总量,绿线MA,两组数据都有抬头趋势;而且都超过年初。可以得出结论,极低失业率都时期已经过去,回到21年的高位只是时间问题。
Continues Claim

美国消费者终于把钱花完了?

美联储警告消费者将在第三季度末耗尽超额储蓄。旧金山联储研究人员周三撰写了一份报告,解释称美国家庭的过多储蓄将在第三季度末或大约 44 天内(截至周四)耗尽。 再加上循环信贷(即信用卡债务)和信用卡利息创历史新高,再加上几周后重新启动学生贷款偿还——所有这些都可能是一场正在酝酿的完美风暴,可能表明消费者的前景正在恶化。 “双德经济”时代形势严峻。

旧金山联储表示:“我们最新的估计表明,到 6 月份,家庭持有的超额储蓄总额不足 1900 亿美元。前景存在很大的不确定性,但我们估计这些超额储蓄可能会在 2023 年第三季度耗尽。”

下图显示,得益于疫情期间政府的刺激检查和其他财政措施,2021 年 8 月累计名义超额储蓄总额为 2.1 万亿美元。 自那时以来,个人储蓄总额已跌至大流行前水平以下,这表明当通货膨胀超过工资时,与大流行相关的超额储蓄将全面减少,迫使家庭从储蓄中提取资金以维持收支平衡。 储蓄的减少很缓慢,然后在 2022 年每月增加到 1000 亿美元。
US Consumer

截至 6 月份,预计提款额为 1.9 万亿美元,而剩余的超额储蓄不足 1,900 亿美元。 研究人员表示,如果继续以过去 3、6 或 12 个月的平均速度提款,“超额储蓄总额可能会在 2023 年第三季度耗尽。”

“大流行性衰退开始后,超额储蓄的迅速积累和随后的减少与之前的衰退形成了鲜明的对比。当数据根据通货膨胀进行调整时,以及当我们将超额储蓄定义为趋势储蓄的一部分或 与经济衰退前时期相比的百分比变化,”研究人员表示。

这是因为循环信贷(即信用卡债务)和信用卡利息都创下了历史新高。 我们说过这种轨迹是不可持续的,举债的美国消费者碰壁只是时间问题。

储蓄不断减少的负债累累的消费者也将在未来几周内重新开始偿还学生债务。 我们问:学生贷款偿还——会引发经济衰退吗? 并告诉读者,这可能会给消费者支出带来每月 158 亿美元(或每年 1,900 亿美元)的潜在逆风。

这凸显了人们对消费者未来可能面临重大挑战的担忧。 这些挑战可能正是美联储所需要的,以引发经济放缓并引导通胀回到 2% 的目标。

美联储7月会议纪要总结

Powell

在美联储 7 月 25 日至 26 日的会议上,美联储官员对于是否需要进一步加息存在分歧,“一些与会者”指出,尽管“大多数”政策制定者继续优先考虑加息,但过度加息会给经济带来风险。 根据周三公布的会议纪要,对抗通胀。

会议纪要称,“与会者仍然坚定地致力于将通胀率降至……2%的目标”,联邦公开市场委员会的政策制定者一致同意将基准隔夜利率提高至 5.25%。 5.50%范围。 “大多数参与者继续认为通胀存在重大上行风险,这可能需要进一步收紧货币政策。”

然而,关于持续货币紧缩影响的谨慎声音似乎在上个月会议的辩论中发挥了更为突出的作用,这表明随着政策制定者权衡通胀正在下降的证据并判断潜在损害,美联储内部的意见分歧已经扩大 如果利率提高到高于必要水平,就会影响就业和经济增长。

会议纪要称,该小组还“讨论了可能影响未来政策决定的几项风险管理考虑因素”。 尽管大多数人仍将通胀视为首要风险,但“一些与会者评论说,尽管经济活动具有弹性,劳动力市场依然强劲,但经济活动仍然存在下行风险,失业率也存在上行风险。”

会议纪要称,总的来说,美联储政策制定者一致认为,不确定性水平仍然很高,未来的利率决定将取决于“未来几个月”公布的“总体”数据,以“帮助澄清通货紧缩过程的程度”。 正在继续”——这可能表明,对于借贷成本的进一步上升,我们将采取更加耐心的态度。会议纪要公布后,美国国债收益率触及盘中高点,而美国股市则扩大跌幅。 美元(.DXY)兑一篮子货币走高。

但美联储工作人员的分析和政策制定者的观点都表明,潜在的“软着陆”正在形成,就业岗位持续增加,经济增长,一些人相信通胀将继续下降。

虽然与会者“强调”需要继续取得进展,以适应通胀将回到美联储2%的目标,但他们也“列举了一些初步迹象,表明通胀压力可能正在减弱”,从住房通胀放缓到通胀指标降低 最近的调查中的预期。

美联储工作人员向政策制定者提出了自己独立发展的经济观点,他们放弃了对今年晚些时候经济衰退的预测,但继续认为通胀将在今年年底和明年下降,并逐步回归央行目标。

以美联储首选指标个人消费支出价格指数衡量的通胀率于 2022 年 6 月达到年率 6.9% 的峰值,但截至今年 6 月已降至 3%。

美联储工作人员表示,他们预计今年下半年基础价格将“下降”。

与联邦基金利率挂钩的合约投资者大量押注美联储在当前的紧缩周期内不会再次提高政策利率。 他们认为央行在 9 月 19 日至 20 日的会议上维持利率不变的可能性接近 90%,与会议纪要发布前基本保持不变。

Week Ahead

  • 周三的SPGlobal服务业PMI
  • 周四的耐用品消费数据
  • 周五的鲍威尔讲话

US and European Market

The US market has entered a correction since August, meanwhile, US bonds get downgraded by Fitch to AA+. This is the second time the US gov bond has been downgraded since 2011 (1st time was by SP Global). The decision has not yet impacted the fundamental drivers of the economy and markets.

What a month for the bond market. The 10-year Treasury yield rose to a fresh high for the year, flirting with last year’s cycle peak of 4.31%. While the bond market has already priced in the additional 50 bps Fed rate increase, the equity market only follows slightly. We keep our view that the economic downturn is underway and the turning point will arrive in the coming quarter.

Treasuries remain the world’s premier safe asset. That is not because of the U.S. debt’s credit rating, but because of the Treasury market’s enormous liquidity and market depth, allowing international investors to store money and invest in the government debt of the largest economy, whose currency is the world’s reserve. For now, there is no other asset class to act as a realistic alternative. The new additional treasuries the US gov gonna issue should not be a concern for bond investors but rather for equity investors. The divergences between the market iv and individual iv, top stocks gain and general gain, MA200 and current S&P500 level, etc. have extended to new levels. Therefore the current correction should not become a surprise.

The job data as usual, shows mixed signals and seems very artificial. Non-farm payroll added 187,000 jobs in July, slightly less than economists expected and the smallest gain since December 2020, while the unemployment rate ticked down to 3.5%, the lowest since the 1960s. From here, we believe the huge divergence from historically low unemployment to the dying PMI data has reached a dead end. From September on, the job data has nowhere to go but weaker. And because employment is logging data, once it’s turning we might find ourselves already in a deep recession.

interest_expense

Besides all, the Federal gov interest expenses concerning the market. It surpassed the 2008 recession level and now chasing up the 2000. It’s not hard to conclude that Fed either act soon or let America crash again;).

Indices Update

As we discussed, fundenmantally US market is in a volatile time. VIX is picking up; divergence has reached a new high; market risk is pressing. We do not hold/recommand any US index atm.

Although, we continue seeing opportunities in the European market. CAC’s MAs are regressing to the current level. If it breaks up 7500, we eye on 8000; but if it falls from here, we will build our positions on 7109. DAX offers a simliar sentiment, and 15610 is a good level to swing play.

If The FTSE 100 touched its bolling band the week ago which was at 7252, which is at its bull/bear reversion point. Once it breaks 7306 (MA120), the uptrend will be coming in a short window. And US market obviously has better chance than rest European indices so we don’t do any relevant recommendation at this point.

Stock Pool Update

We use Quant method with financial indicators to screen stocks, and we suggest investors do their own research with FCF modelling & fundamental analysis and consider the risk involved in

We stopped recommending any technology sector stocks at this stage base on the reason that risk/reward was too low and we believe any mentally stable adult shouldn’t be doing so.

VALE:
We added some additional positions of HDB and maintain it as a strong buy at 13.22

JD:
If positions can average down to around 33.65 would be a strong supporting level.

FX Market & Currency Hedging

As we predict last month, GBP/USD reversed after breif touching a new ytd high at around 1.30, to around 1.27 now. We continue to recommand investors to hedge against GBP if exposed to any British asset.

As our model shows GBP won’t go any further (due to the market priced-in a possibly incorrect interest rate, and mortgage stress), and will correct to 1.25 level soon enough.

Commodities

Crude Oil has reached above $80 this month due to the supply countries new cutting plan and the inflation fear dims. We suggest investors to take advantages of the volatility and apply the mean reversion strategies. Consider supporting level at 65/67/69 if going long, and short once it breaks 85.

It isn’t a good time to enter Gold market because its price largely affected buy uncertain rate decisions and fluctuating FX market. Can short once it enters the 2000 zone (can build short positions from 2080).

Natural Gas consolidating in between 2.2 and 2.7 berfore reaching the half year high of 3 dollar, we continue to short its volatility and therefore suggest the price stability soon.

Soybean: As we predicted a gloom furture of Chinese econmy, Soyabean market had its blood bath over a month from 1410 to 1300s. One of big buyers of Soybean is China, and due to obvious reasons its just unclear how will China’s economy be doing at Q3 and even the current season. Based on the PMI data and M1 M2 gap we continue to be bearish on Chinese economy. Long from 1285.

US and European Market

The US market has reached new yearly high again, while it’s been fluctuating weeks in the alarming position.

The job and service data remains resilient, which offers more chances to let the yield staying higher for longer. The stronger than expected labor market data drove the US 10 year bond yield to over than 4% at highest over a year.

While the bond market has already priced-in the additional 50 bps Fed rate increase, equity market only follows slightly. We keeps our views that the economic downturn is underway and the labor market softening will arrive in the coming quater.

By breaking down the data in the last month, although the unemployment rate remains resilient Non-farm payroll and manufactory related data (i.e. PMI) emerged weakening trend. Total nonfarm jobs added in June were 209,000, below expectations of 230,000 and well below last month’s 306,000. Meanwhile, the average hourly wage gains continue to remain elevated at 4.4%, versus expectations of 4.2%.1 The Fed would like to see wage growth head toward 3.5% to remain consistent with a 2.0% inflation target. The weekly jobless claims figure moved higher, while total job openings moved lower, heading below 10 million once more. Both measures tend to be more forward-looking indicators of the labor market and point to some easing ahead.

Overall, the labor and service data are lagging data. We continue to suggest that it is where the market peaking once labor and service data weakening begins.

PMI

The gap between ISM service and manufacturing has extended last month, showing a softening industrial demand and sticky service need. Over 70% of GDP in the US are consist of services, so the healthy demand for services currently has shown up in better economic growth and resilient consumer confidence broadly. But, any deepening slowdown in one area will affect the other and vice versa. Long as the ISM manufacturing keeps its current pace, the economy is heading to a recession inevitably.

Although, we continue seeing some gamble opportunities in the FTSE. The FTSE 100 touched its bolling band the week ago which was at 7242, which is at its bull/bear reversion point. Once it breaks 7306 (MA120), the uptrend will be coming in a short window. And US market obviously has better chance than rest European indices so we don’t do any relevant recommendation at this point.

Stock Pool Update

We use Quant method with financial indicators to screen stocks, and we suggest investors do their own research with FCF modelling & fundamental analysis and consider the risk involved in

We stopped recommending any technology sector stocks at this stage base on the reason that risk/reward was too low and we believe any mentally stable adult shouldn’t be doing so.

HDB:
We added some additional positions of HDB and maintain it as a strong buy at 62.82

TSCO:
If positions can average down to around 217.65 would be a strong supporting level.

FX Market & Currency Hedging

GBP reached a new ytd high and breaks the resistance of USD at around 1.30, 52 weeks high to EUR. We recommand investors to hedge against GBP if exposed to any British asset.

As our model shows GBP won’t go any further (due to the market priced-in a possibly incorrect interest rate, and mortgage stress), and will correct to 1.25 level soon enough.

Commodities

Crude Oil has reached $76 this month due to the State strong buying power and the inflation fear dims. We suggest investors to take advantages of the volatility and apply the mean reversion strategies. Consider supporting level at 65/67 if going long, and short once it breaks 80.

It isn’t a good time to enter Gold market because its price largely affected buy uncertain rate decisions and fluctuating FX market.

Natural Gas consolidating in between 2.2 and 2.7, we continue to short its volatility and therefore suggest the price stability.

Soybean: One of big buyers of Soybean is China, and due to obvious reasons its just unclear how will China’s economy be doing at Q3 and even the current season. Based on the PMI data and M1 M2 gap we continue to be bearish on Chinese economy.

本周一张图:

USDCNY

本周一张图要说说这周人民币兑美元走势。可以说从周一开始,美元就是单边走势一路杀到7.15左右。在周三Fed鹰派暂停加息后,市场更是把美元推到了一个高位,这时候不光人民币,包括美元一揽子指数都在高位。之后周四开盘由于中国的经济数据,人民币差点跌穿7.20的关键位置。之后由于ECB的加息决策和市场情绪反转把人民币推到周内高点。可以说这周是汇率过山车走势🎢,像这种波动率大的市场对daytraqding会比较友好。像这种情况货币对冲会比较难处理。

本周市场数据:

指数

本周收在4404,高开低走。周五跳水但是还是稳定了周内2.58%的收益,4小时级别的图几乎天天有gap,并且创出52周新高。同时资金周内从MMF回流股市,FED暂停加息,失业率抬头,sp500进入技术性牛市。唯一要小心的是下半年recession的风险。这周我也用闲置的资金做了几个swing play,让资金周转起来,但是还是不看好中长。。。

Week 1 Month 3 Month YTD
2.58% 5.19% 11.05% 15.31%
板块

upload successful

板块方面领涨五个板块分别为造车概念股,半导体,电子,铀元素和通讯电子。涨幅分别为5.02%, 4.99%, 4.59%, 3.89%, 3.69%。可以看出来奥,这周基本上还是那几个板块,哦不应该说那几只股票。

锐评:领涨板块过于集中可能会造成冰火两重天的现象,也会加大系统性风险,投资者也可以密切关注下Russel2000。

美联储暂停加息

周三,联储加息会议召开,鲍威尔表示在连续 10 次加息后,央行将维持基准利率不变。

fed-projection

他主要讲了这些:

“我不应该称之为skip。” “真正减息时间需要在几年后。“ “委员会中没有一个人投今年的降息——而且如果你考虑一下,我认为这根本不合适。”

美联储这次可以说是又鹰又鸽,鸽派的暂停加息,而且Powell在会上纠正了skip的说法可以说就是确定了pause的说法。但是基本所有票委都会考虑年内再次加息,而且plot chart调高了之前对于终点利率的预测。在这张图上,除了longrun利率还维持在2.5左右的位置,其他阶段都上调了。年内更是从5.1调到了5.6,也就是年内预测至少会再加两次息。

Maki 说,由于最近关于就业和通胀的经济数据强于许多预测者的预期,本周加息然后在 7 月保持稳定的逻辑本来会更直接、更容易解释。

“他们在做什么,确切地说,不太清楚,”Maki 说。 “目前尚不清楚下一次加息的标准是什么。 这似乎取决于他们在每次会议上的感受。”

周三的预测显示,18 位官员中有 12 位认为,如果经济表现符合他们的预期,他们今年需要将利率提高至 5.5% 至 5.75% 之间或更高。 这将意味着在今年晚些时候举行的四次会议中再增加50个基点。

“下一次加息将比他们意识到的更难,”现任 Dreyfus and Mellon 首席经济学家的前美联储高级经济学家文森特莱因哈特说。 “数据可能会更加模棱两可。 他们的标题解释是他们将在六周内知道更多,但事实是他们在六周内不会知道更多。 很可能,他们会在六周内更加困惑。”

近几个月来,经济仅显示出温和的降温迹象。 自愿离职的工人比例已恢复到接近大流行前的水平,表明劳动力市场紧张的情况有所缓解。

而房地产市场——最初受去年加息打击最严重的行业之一——已经有所改善,表明美联储放慢经济和平衡供需是多么困难。 在去年暴跌的大型科技股的推动下,标准普尔 500 指数最近几天小幅上涨至 2023 年的新高。

fed-assets

锐评:不要光看加息,自从3月银行危机,美联储缩表已经成了一个笑话,一边加息一边扩表这什么骚操作。。。如果非要让我预测,我觉得终端利率就是5.25了

JP 警告:现在的市场很像08金融危机之前

upload successful

摩根大通资产管理公司的首席信息官表示,股市的持续上涨是暴风雨前的平静。 Bob Michele 最近表示,当前的市场状况让他想起了 2008 年 3 月至 6 月的时期。 他说:“我们看到的现在是你只能在衰退中看到的东西,或者你在衰退中快结束的地方。”

摩根大通资产管理首席投资官表示,投资者应警惕持续的股市上涨,因为它并未反映出迫在眉睫的经济风险,而且让人想起导致 2008 年金融危机爆发的那几个月。

鲍勃米歇尔周五告诉 CNBC,当前的市场状况让他想起了 2008 年 3 月至 6 月的时期。

米歇尔说:“我们看到的事情只有在经济衰退时才能看到,或者最终会陷入衰退,”他指的是美联储激进的加息、银行业压力造成的信贷紧缩、与商业真实资产相关的风险 房地产和倒挂的债券收益率曲线,这被广泛认为是经济衰退的指标。

他还指出过去几个月发生的一系列地区性银行倒闭事件,摩根大通在倒闭后接管了 First Republic Bank——就像它在 2008 年 3 月收购投资银行贝尔斯登 (Bear Stearns) 时所做的那样。

他在谈到 2008 年的市场事件时告诉 CNBC,“市场认为这是一场危机,有政策回应,危机已经解决。然后股市出现了连续三个月的稳定反弹。”

米歇尔表示,自 1980 年以来的趋势表明,衰退往往会在美国央行上次加息后一年零一个月内开始。 美联储上个月连续第 10 次加息,自去年春天以来已将利率从接近零上调至 5% 以上,以抑制处于历史高位的通胀。

他认为,如果美联储加息运动结束后美国经济避免衰退,那将是一个“奇迹”。

中国L型复苏

chinese-housing

中国的复苏正在以惊人的速度失去动力。 但北京看起来仍然以牺牲增长为代价专注于安全。

即使考虑到中国面临的大问题——青年失业率居高不下、不利的人口结构以及领导层日益增长的“堡垒经济”思维模式——其后新冠疫情复苏的速度还是惊人的。

周四公布的中国 5 月份主要经济数据最新表明,大流行时代的政策失误造成的损害比早先所怀疑的要严重,而“零新冠疫情”的态势驱使其中许多人持续了太久。 这些数据并没有太多令人满意的地方,尤其是考虑到 2022 年上海封锁带来的弱基数效应本应有助于进行同比比较。

也许最令人担忧的是房价。 自 2 月以来小幅上涨后,5 月 70 个城市的房价平均仅上涨 0.1%,低于 4 月 0.3% 的涨幅。 根据高盛 (Goldman Sachs) 的数据,在所谓的三线城市——主要是内陆的中小城市——经季节性调整后的年化价格实际上下降了 0.5%。

消费者和工业也表现平平。 零售额同比增长 12.7%,低于 4 月份的 18.4%,而工业产值增速从 5.6% 放缓至 3.5%。

北京并没有停滞不前:继周二降息之后,中国央行今天将其一年期中期贷款安排缩减 0.1 个百分点,这是银行的重要融资工具。

但就其本身而言,这不太可能扭转局面。 如果北京想要避免 L 型复苏——像美国在 2008 年金融危机后的缓慢复苏——它需要让家庭和企业相信它会支持。

通胀数据回落,失业金领取数据走高

随着得克萨斯州失业人数飙升,初请失业金人数创 2021 年 10 月以来最高,达到262k。在上周首次申请失业救济人数意外激增(达到 2021 年 10 月以来的最高水平)。 然而,上周有 26.2 万美国人首次申请失业救济(与前一周向上修正的 26.2 万相同),情况仍然很麻烦。

upload successful

由于消费者在包括汽车在内的一系列商品上支出,美国 5 月份零售额意外上升,这可能有助于支撑本季度的经济。

另一组数据显示,截至 6 月 10 日当周,初请失业金人数经季节性因素调整后稳定在 262,000 人。接受路透调查的经济学家此前预计,最近一周初请失业金人数为 249,000 人。

Week Ahead

  • 周三的英国PMI数据
  • 周四的失业金人数,和鲍威尔讲话

Introduction

Inflation is a critical macroeconomic indicator that plays a pivotal role in shaping the economic landscape of a nation. The United States, being one of the world’s largest economies, constantly strives to achieve stable and sustainable inflation rates to support economic growth, maintain price stability, and ensure the well-being of its citizens. The relationship between job and consumption data and inflation has long been a subject of interest and debate among economists. Job market conditions, such as employment levels, wage growth, and labor force participation, have a direct impact on consumers’ income and purchasing power. Concurrently, consumer spending, which drives a significant portion of the US economy.

The research will delve into the theoretical foundations and empirical studies that have explored the relationship between job and consumption data and inflation. It will examine key data, make predictions and analyse fliexbility and sensitivity of the economy in the next 1 to 2 year.

US Inflation Factors and Calculation Method

In June 2022, inflation in the United States accelerated and peaked at around 9%, its highest level since February 1982, as a result of soaring energy costs, labor mismatches, and supply disruptions. But inflation is not a new phenomenon; countries have weathered inflation throughout history.

Several factors influence the US inflation, which mostly includes in the measurement of CPI:

  • Monetary Policy: The actions taken by the Federal Reserve to adjust interest rates, control money supply, and manage the economy impact inflation. Lower interest rates and expansionary monetary policies can stimulate spending and potentially increase inflation, while tighter monetary policies can aim to reduce inflationary pressures.
  • Demand and Supply: The overall demand for goods and services in the economy, coupled with the available supply, plays a significant role in determining inflation. When demand outpaces supply, prices tend to rise, leading to inflationary pressures. Conversely, if supply exceeds demand, it may lead to lower prices or deflation.
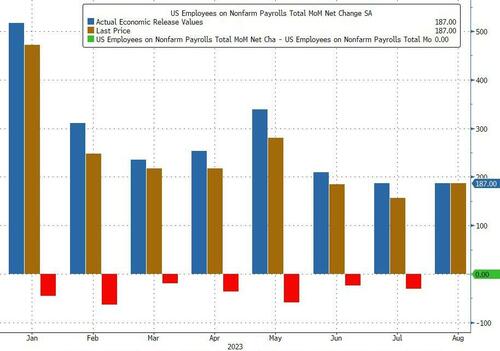
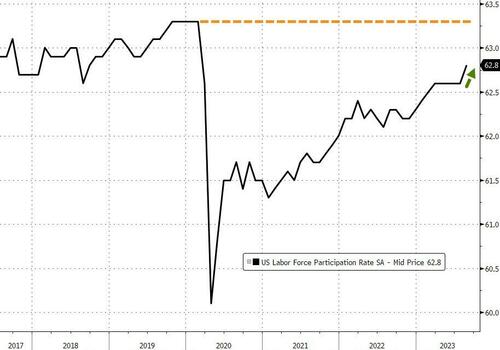
  • Labor Market Conditions: Wages and employment levels impact inflation. When there is low unemployment and strong demand for labor, wages tend to rise, increasing production costs for businesses. These increased costs may then be passed on to consumers, leading to inflationary pressures.
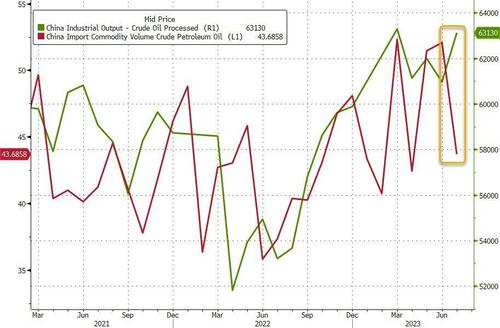
  • Energy and Commodity Prices: Fluctuations in energy prices, such as oil and gas, as well as the prices of other key commodities, can influence inflation. Changes in these prices affect production costs for businesses, which may result in adjustments to consumer prices.
  • Government Policies and Fiscal Measures: Government policies, such as taxation, subsidies, and regulations, can influence inflation. Fiscal measures, such as government spending and budget deficits, can impact the overall level of demand in the economy, potentially leading to inflationary pressures.

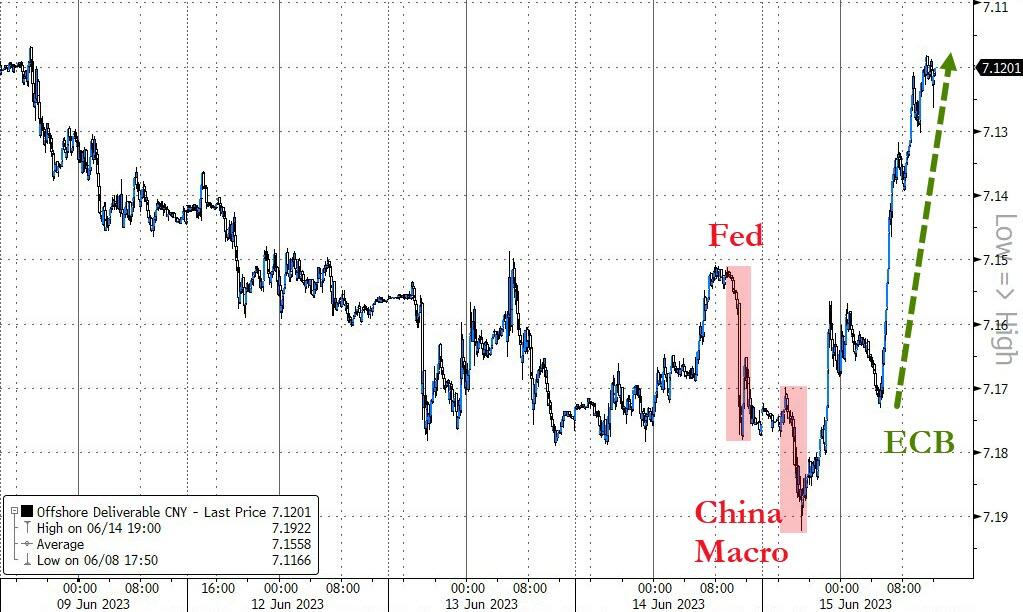
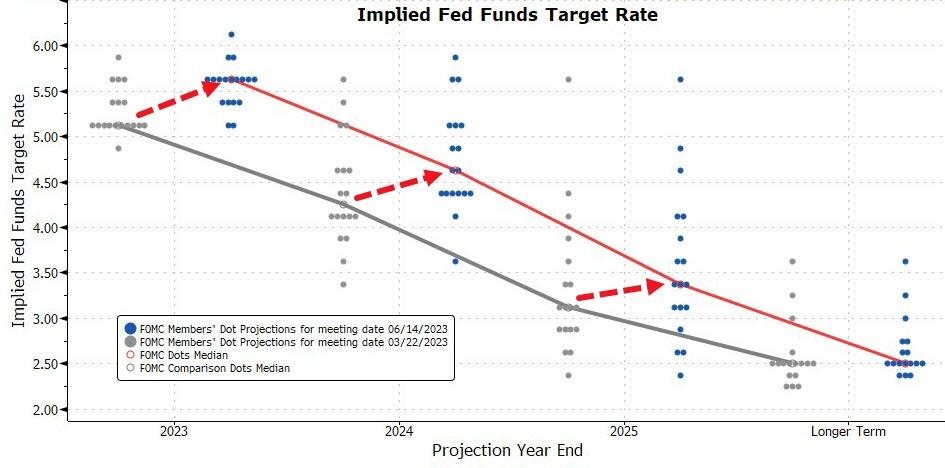
As Fed devoted to fight inflation and maintain price stability, central banks started the rates rising race. After increasing interest rate 10 times in a row, Fed finally decided a “skip” in June 2023. The “skip” is basically due to recent bank crsis and CPI decline.

The CPI is often reported as a percentage change from a reference period, indicating the inflation rate. Economists use CPI data to monitor inflation trends, make policy decisions, adjust wages and benefits, and assess the impact of inflation on the economy and households’ purchasing power. The statistics are normally including Selection of Basket of Goods, Price Data Collection, Headline Items, Services, Energy, etc. within CPI calculation.

Table A. Percent changes in CPI for All Urban Consumers (CPI-U): U.S. city average

Seasonally adjusted changes from preceding month Un-
adjusted
12-mos.
ended
May 2023
Nov.
2022
Dec.
2022
Jan.
2023
Feb.
2023
Mar.
2023
Apr.
2023
May
2023

All items

0.2 0.1 0.5 0.4 0.1 0.4 0.1 4.0

Food

0.6 0.4 0.5 0.4 0.0 0.0 0.2 6.7

Food at home

0.6 0.5 0.4 0.3 -0.3 -0.2 0.1 5.8

Food away from home(1)

0.5 0.4 0.6 0.6 0.6 0.4 0.5 8.3

Energy

-1.4 -3.1 2.0 -0.6 -3.5 0.6 -3.6 -11.7

Energy commodities

-2.1 -7.2 1.9 0.5 -4.6 2.7 -5.6 -20.4

Gasoline (all types)

-2.3 -7.0 2.4 1.0 -4.6 3.0 -5.6 -19.7

Fuel oil(1)

1.7 -16.6 -1.2 -7.9 -4.0 -4.5 -7.7 -37.0

Energy services

-0.6 1.9 2.1 -1.7 -2.3 -1.7 -1.4 1.6

Electricity

0.5 1.3 0.5 0.5 -0.7 -0.7 -1.0 5.9

Utility (piped) gas service

-3.4 3.5 6.7 -8.0 -7.1 -4.9 -2.6 -11.0

All items less food and energy

0.3 0.4 0.4 0.5 0.4 0.4 0.4 5.3

Commodities less food and energy commodities

-0.2 -0.1 0.1 0.0 0.2 0.6 0.6 2.0

New vehicles

0.5 0.6 0.2 0.2 0.4 -0.2 -0.1 4.7

Used cars and trucks

-2.0 -2.0 -1.9 -2.8 -0.9 4.4 4.4 -4.2

Apparel

0.1 0.2 0.8 0.8 0.3 0.3 0.3 3.5

Medical care commodities(1)

0.2 0.1 1.1 0.1 0.6 0.5 0.6 4.4

Services less energy services

0.5 0.6 0.5 0.6 0.4 0.4 0.4 6.6

Shelter

0.6 0.8 0.7 0.8 0.6 0.4 0.6 8.0

Transportation services

0.3 0.6 0.9 1.1 1.4 -0.2 0.8 10.2

Medical care services

-0.5 0.3 -0.7 -0.7 -0.5 -0.1 -0.1 -0.1

Footnotes
(1) Not seasonally adjusted.

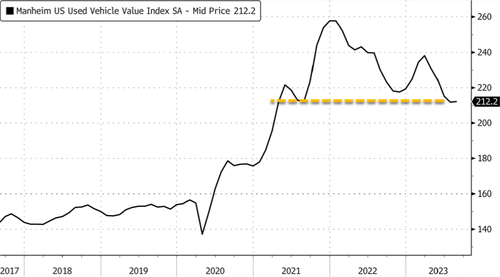
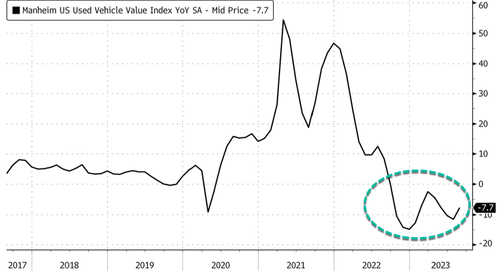
Here above is the CPI data released by US Bureau of Labor Statistics at 13th of June. The index for shelter was the largest contributor to the monthly all items increase, followed by an increase in the index for used cars and trucks. The food index increased 0.2 percent in May after being unchanged in the previous 2 months. The index for food at home rose 0.1 percent over the month while the index for food away from home rose 0.5 percent. The energy index, in contrast, declined 3.6 percent in May as the major energy component indexes fell.

Based on the weight, persistance and impact, we will focus on the shelter (labor), food away and auto (consumer).

Quant (coef, sensitivity)

To predict the future trend of US inflation and understand the relationships between ecnomic data and inflation, we need to first estimate the coeficiency between labor, consumer and CPI. With the machine learning, we collected the data between 2013 and 2023, and put it to run in a machine learning BayesianRidge fitting test. The consumer and job data are used as training data set, while they seprately analysed as predict set.

With the result:

R square: 87.75429500104834

Slope: [0.01940615 3.8098487 ] (Job/consumer)

Intercept: 99.48466424568565

Predicted response:
[229.26361351 234.03735393 229.9032398 234.33723222 232.19437078
233.32572405 229.47446669 233.43602215 233.38337997 238.45683648
242.3111137 234.37774196 229.68380514 238.86666929 239.5959317
237.77830599 243.60513265 239.96090529 248.70507671 240.76258386
242.2459265 243.23330403 242.04279104 247.68835769 239.14206855
……………………………..
255.20443757 251.10885394 262.61126391 255.09781159 247.79216116
253.7513393 256.93403906 257.69089597 257.476193 261.48627715
266.50623011 268.89795852 270.74930181 272.77203262 269.04632847
271.3200653 277.40210706 275.50297793 275.22691572 276.47396304
275.75946459 274.44041848 275.18601152 273.72124508]

figure
figure
figure
figure

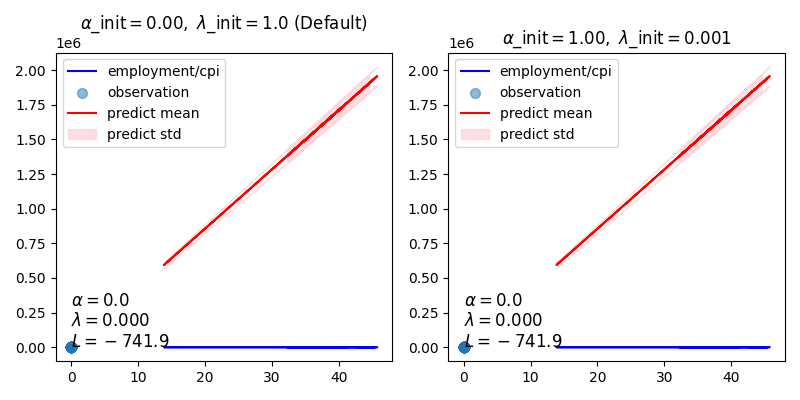
For the best fit we tested few arguments, with few stable predictions above.

With all the data, we now conduct a sensitivity analysis:
upload successful

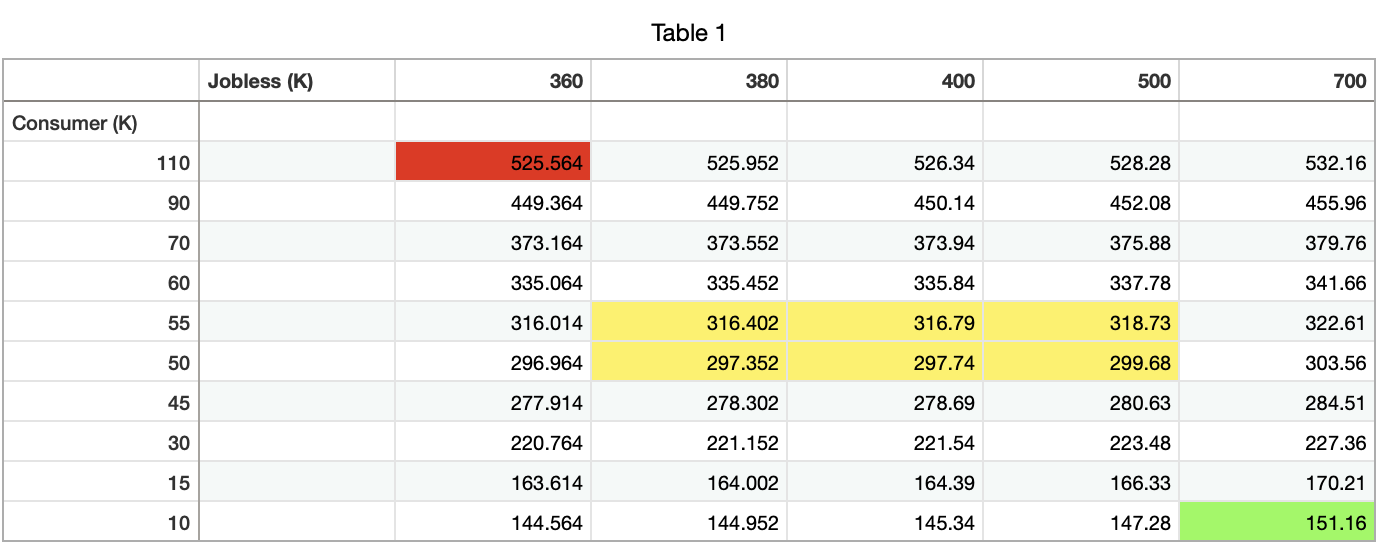
Take 316.402 as an example. As current CPI data (304.127) and average 2% MOM incremental speed, 304.127 * 1.002 ^ 20 = 316.52 will be the CPI in 20 months. Therefore, the YOY CPI at that time will be 316.52 / (304.127 * 1.002 ^ 8) - 1 = 2.42%.

Trading Strategy

The result shows that in an average economic environment, namely job data dims a bit from the current overheating market and supply chains catches up with the consumer, the CPI data in the next 1 - 2 year most likely will reach from 299.68 to 316.40 and YOY increase will maintain in the 2% range. Good news for long-term investors but can we monetise it?

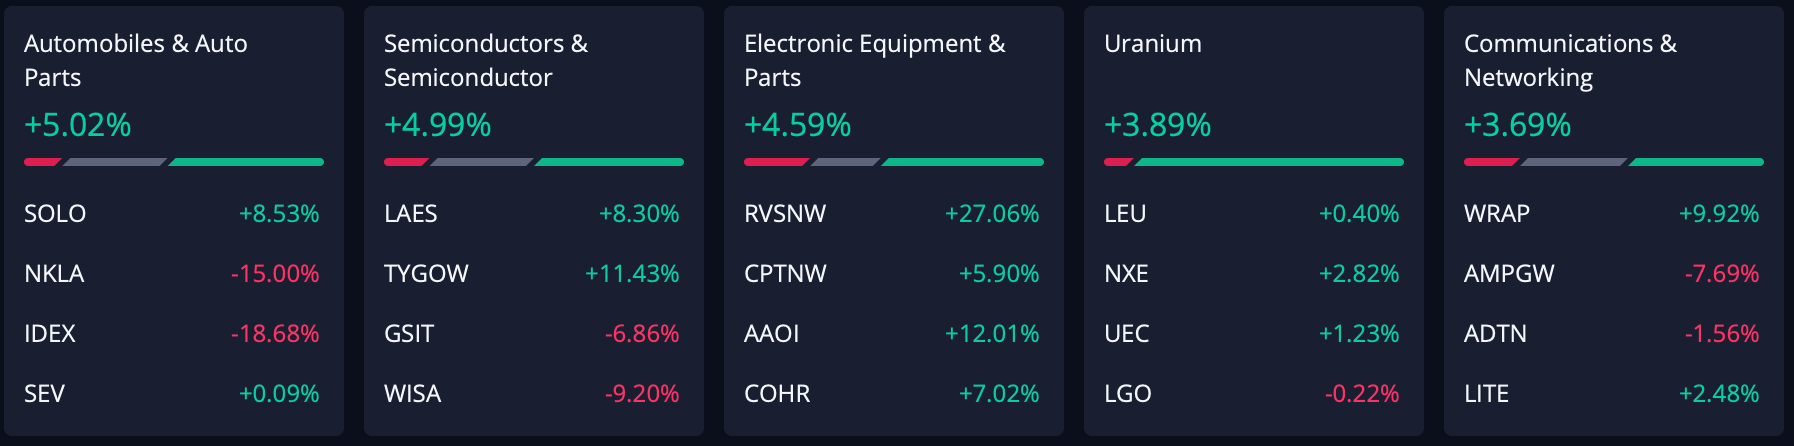
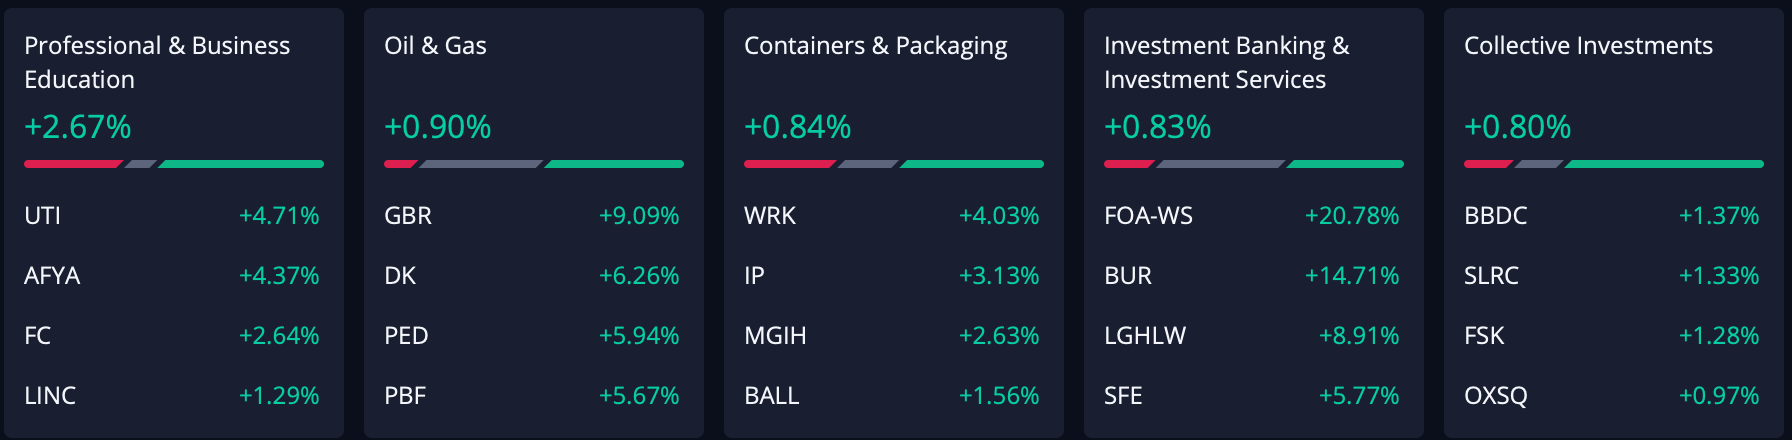
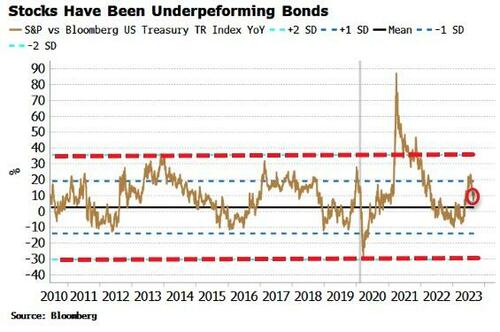
Treasuries will obviously benefit from it based on the inflation trend and interest expectations. Then, the banking sector. Energy or tech might dip most with this going forward.

Investors could long bonds and long JPM. The most aggressive ones could also have long bonds and pair with writing TQQQ calls.

US and European Market

The US market has reached YTD high, while the economic slowdown is underway.

The rally has been powered by the enthusiasm around artificial intelligence (AI) and a resilient economy that has defied expectations for a slowdown in the face of higher interest rates. But central banks are taking notice, with the Reserve Bank of Australia (RBA) and the Bank of Canada (BoC) surprising markets with more tightening. We offer our perspective on what makes this cycle unique and how it may play out in the second half of the year.

bear-market
According to a research from Edward Jones, the current market could be the longest dead cat bounce, or the weakest bull market rally, neither sounds attractive.

In our opinion, there isn’t a bull market until the economic slowdown is not slowdown. Recent trend including unexpecting China’s export data, US PMI falls for consistent 7 months, and unemployment picking up. We won’t feel comfortable to place any long-term bet before those trends going away.

Although, we did observe some speculation oppounities. The FTSE 100 touched its bolling band the week ago which was at 7442. Let’s see could it break the band and potentially a good swing play chance at around 7303 (MA120).

Stock Pool Update

We use Quant method with financial indicators to screen stocks, and we suggest investors do their own research with FCF modelling & fundenmantal analysis and consider the risk involved in

We stopped recommending any technology sector stocks at this stage base on the reason that risk/reward was too low and we believe any mentally stable adult shouldn’t be doing so.

NUE:
We keep maintaining the NUE as a strong buy at 131.11

ELV:
If positions can average down to around 440.15 would be a strong supporting level.

FX Market & Currency Hedging

GBP reached a new high to USD at around 1.25, 52 weeks high to EUR. We DON’T recommand British investors to hedge any assets exposing to US or EU market

As our model shows GBP won’t go any further (due to the market priced-in a possibly incorrect interest rate).

Commodities

Crude Oil has fluctated above 70 recent month due to the State strong buying power. We suggest investors can make mean reverse strategies. Consider supporting level at 65/67 if going long.

It isn’t a good time to enter Gold market because its price largely affected buy central banks decisions.

Natural Gas same as Oil

Soyabean: One of big buyers of Soyabean is China, and due to obvious reasons its just unclear how will China’s economy be doing at Q3 and even the current season. Building mean reversion positions at around 1300 if the price dropps further.

0%